Data and Code: Chord Diagrams for Journey To Work Data
Urban Science Lab @ Sydney
Chord Diagram Visualizations for Sydney 2016 Census Journey To Work Flows
Chord Diagram Visualizations for our 2020 paper
in Urban Studies on
Measuring polycentricity via network flows, spatial interaction and
percolation.
Here are the regions in the Sydney Greater Metropolitan (GMR) Region. We
want to identify the biggest origins and destinations. That is, we want to
identify the regions that have the largest number of people going to work
somewhere else in the GMR, as opposed to those regions that attract the
largest number of people into them. These primary work destinations,
Statistical Areas Level 4 (SA4 by the Australian Bureau of Statistics
defined Australian Statistical Geography) are "centres".
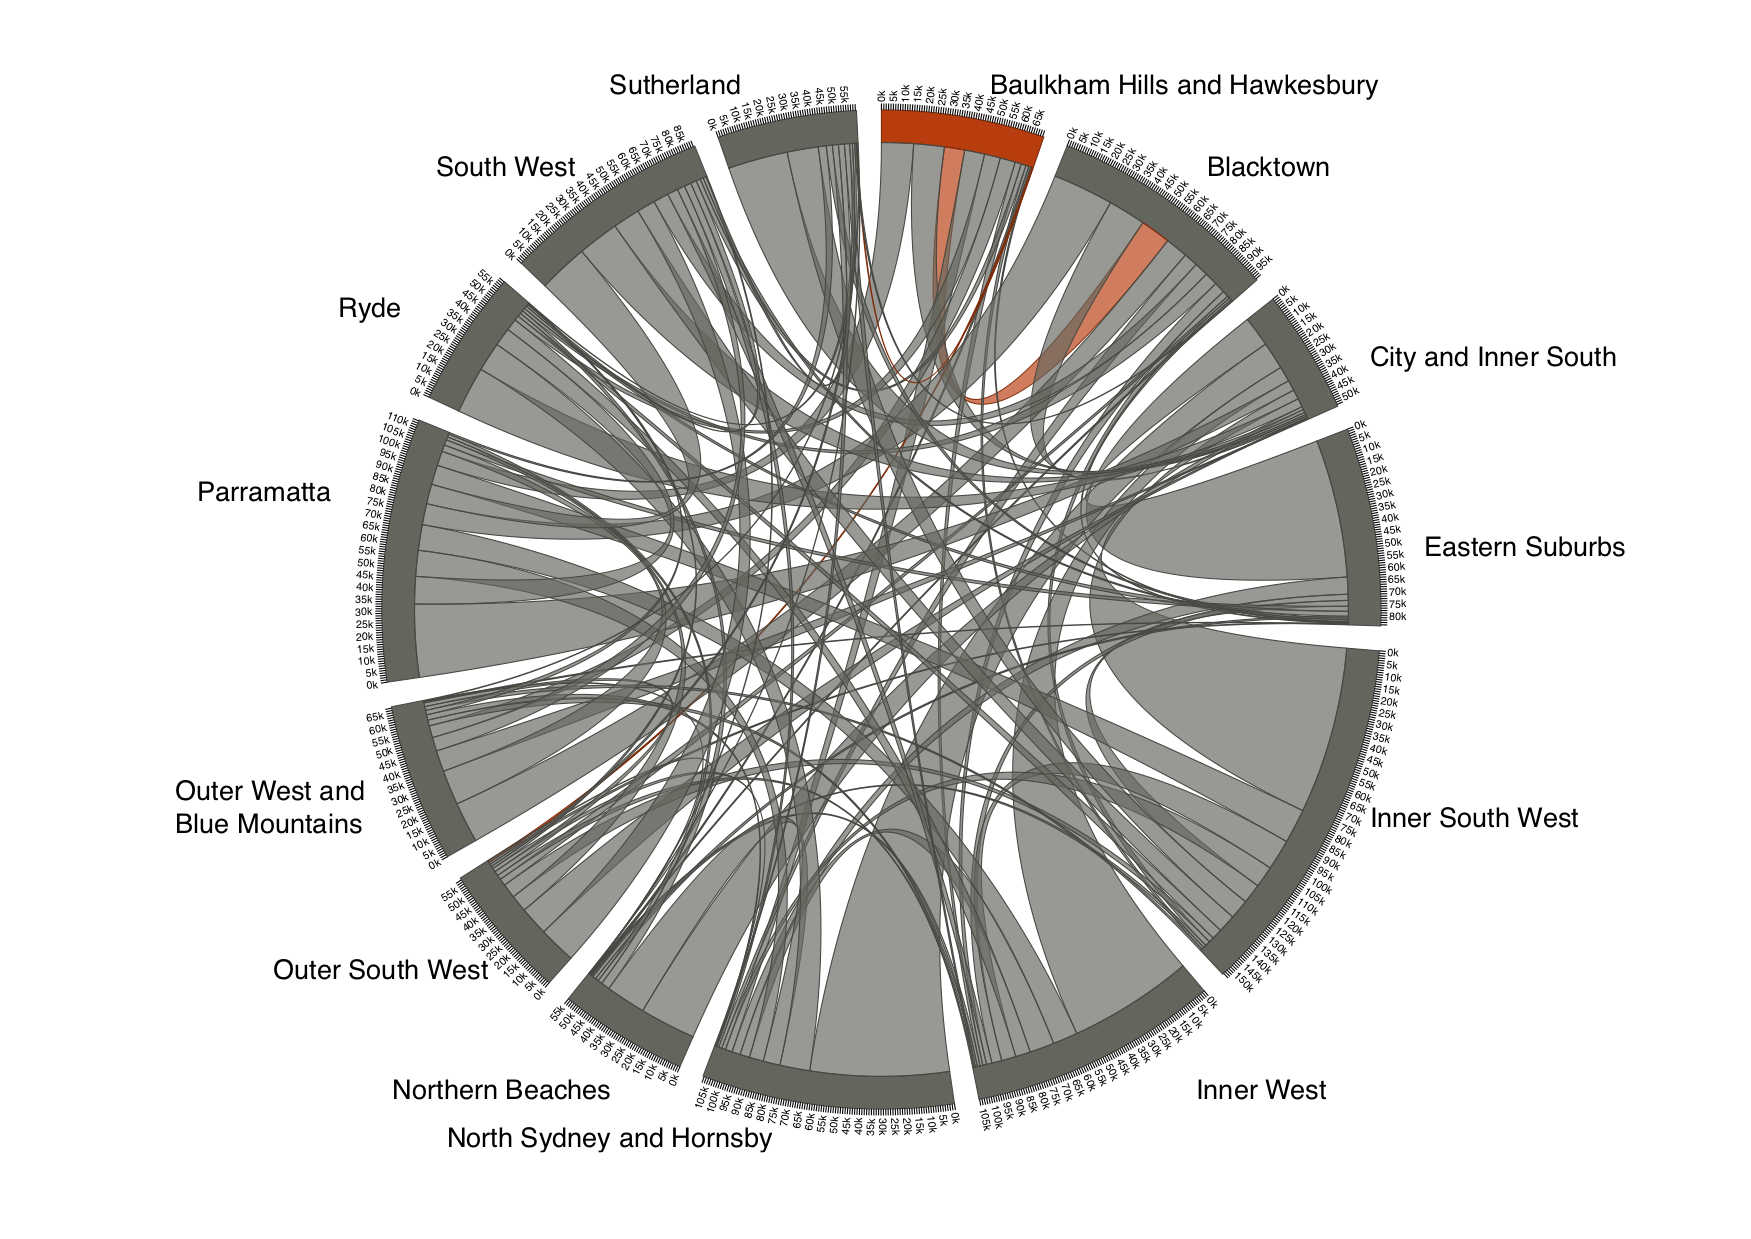
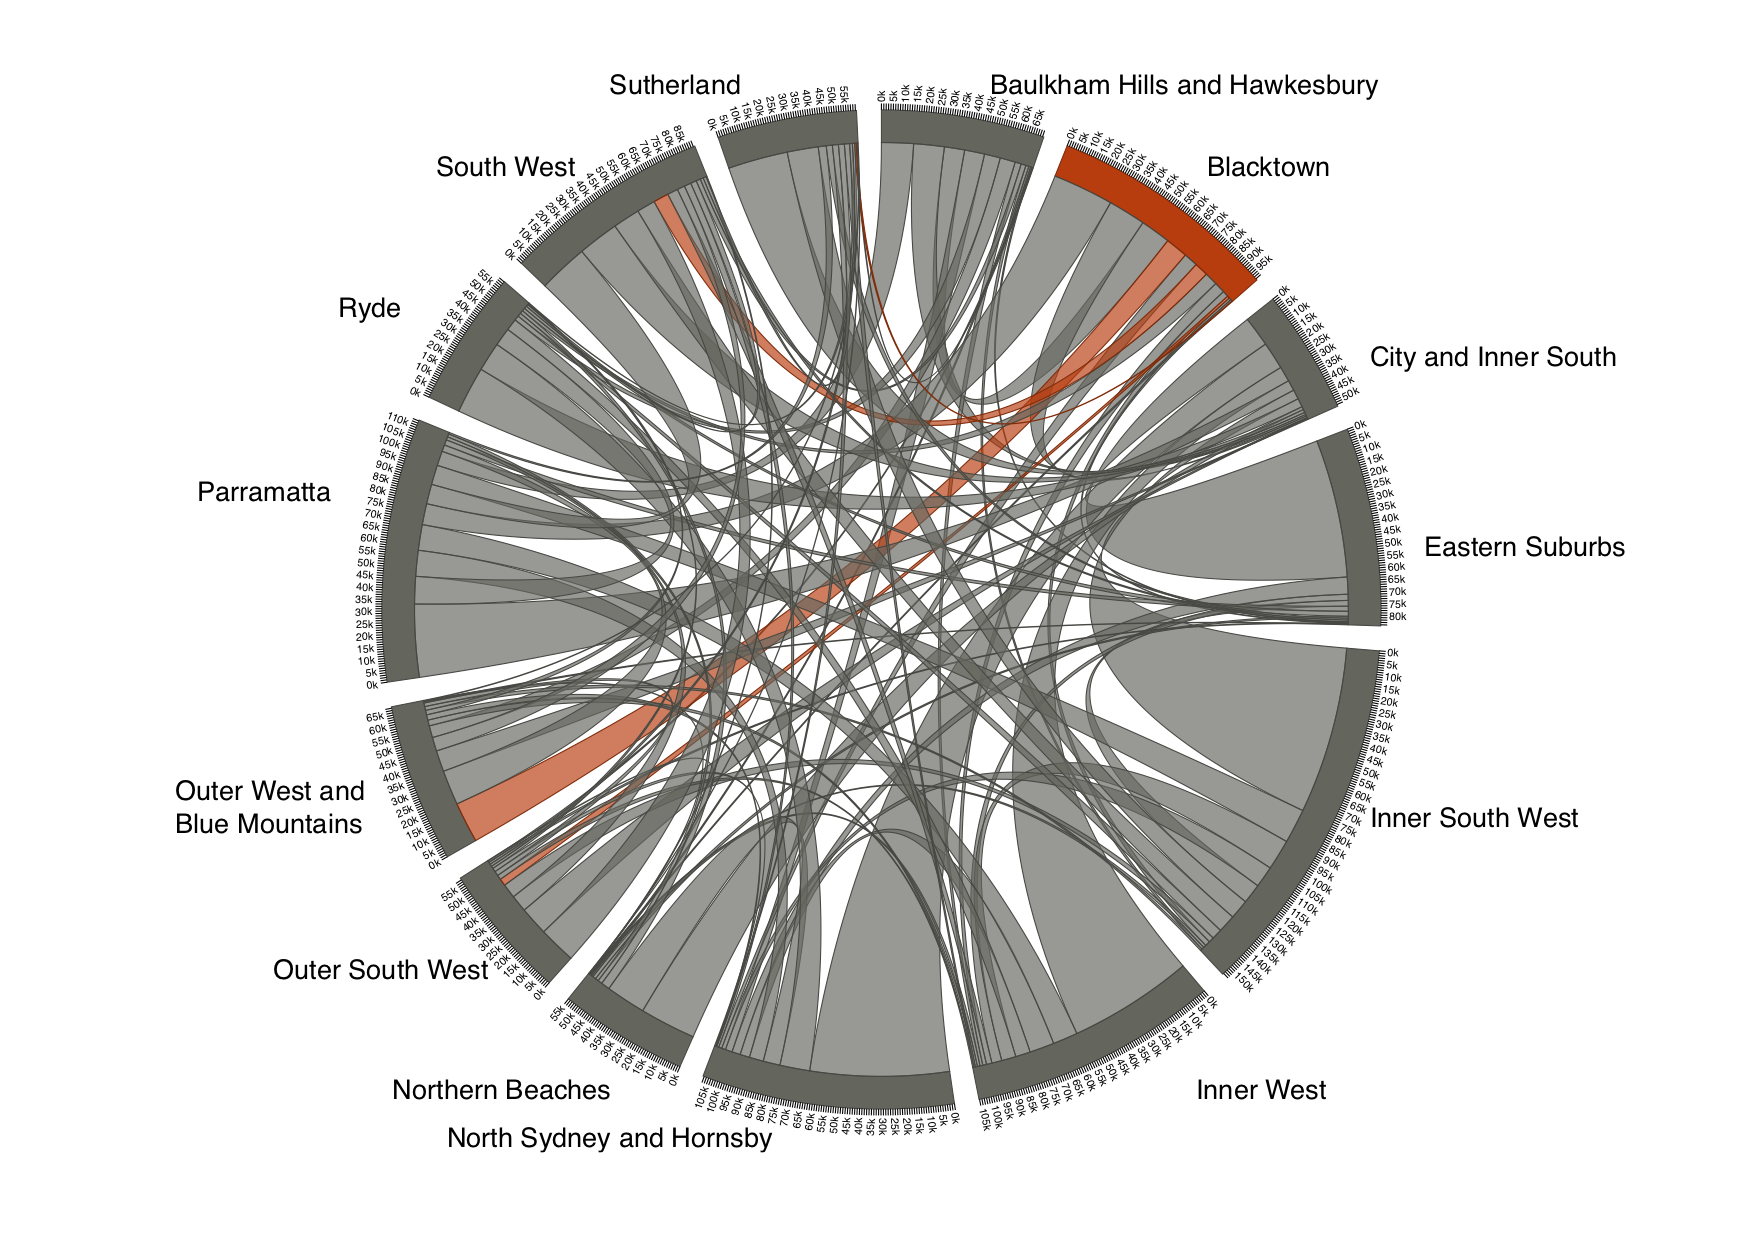
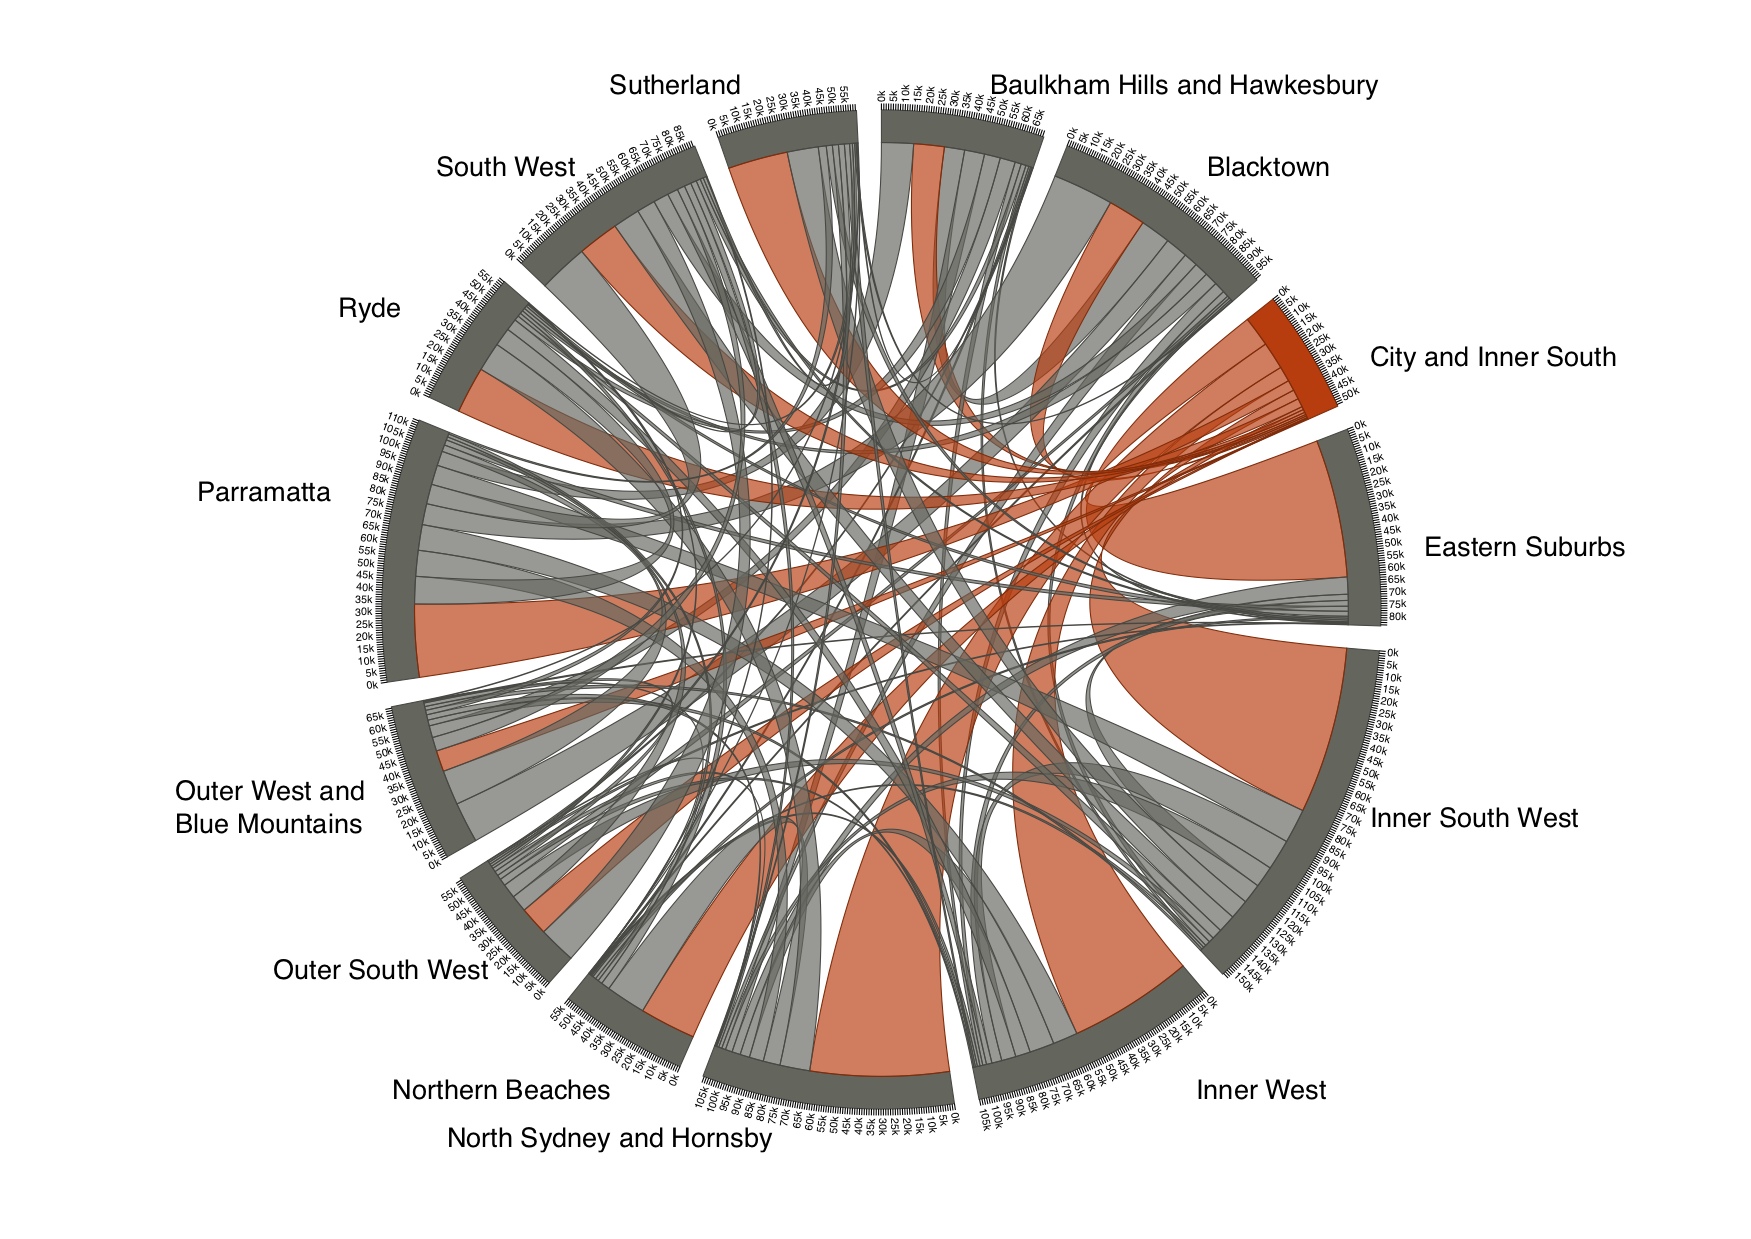
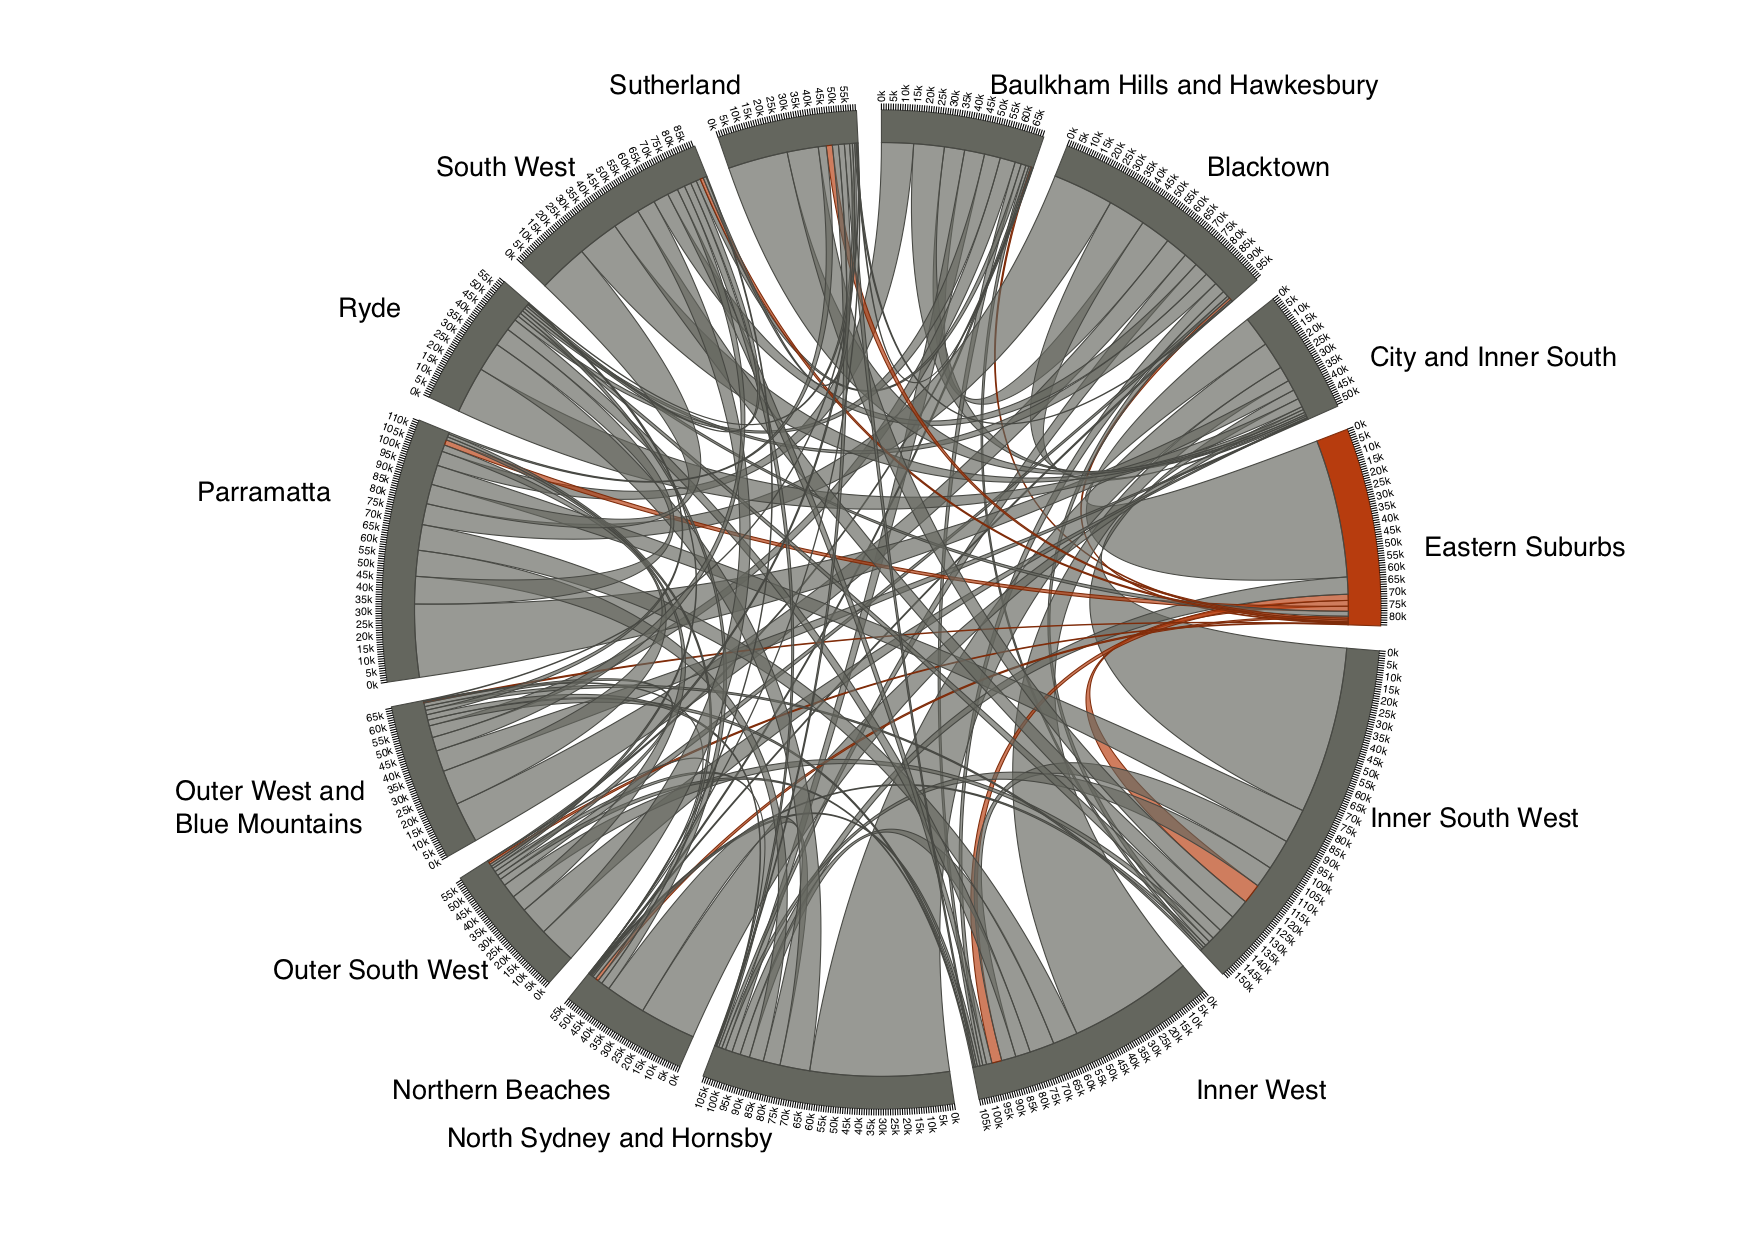
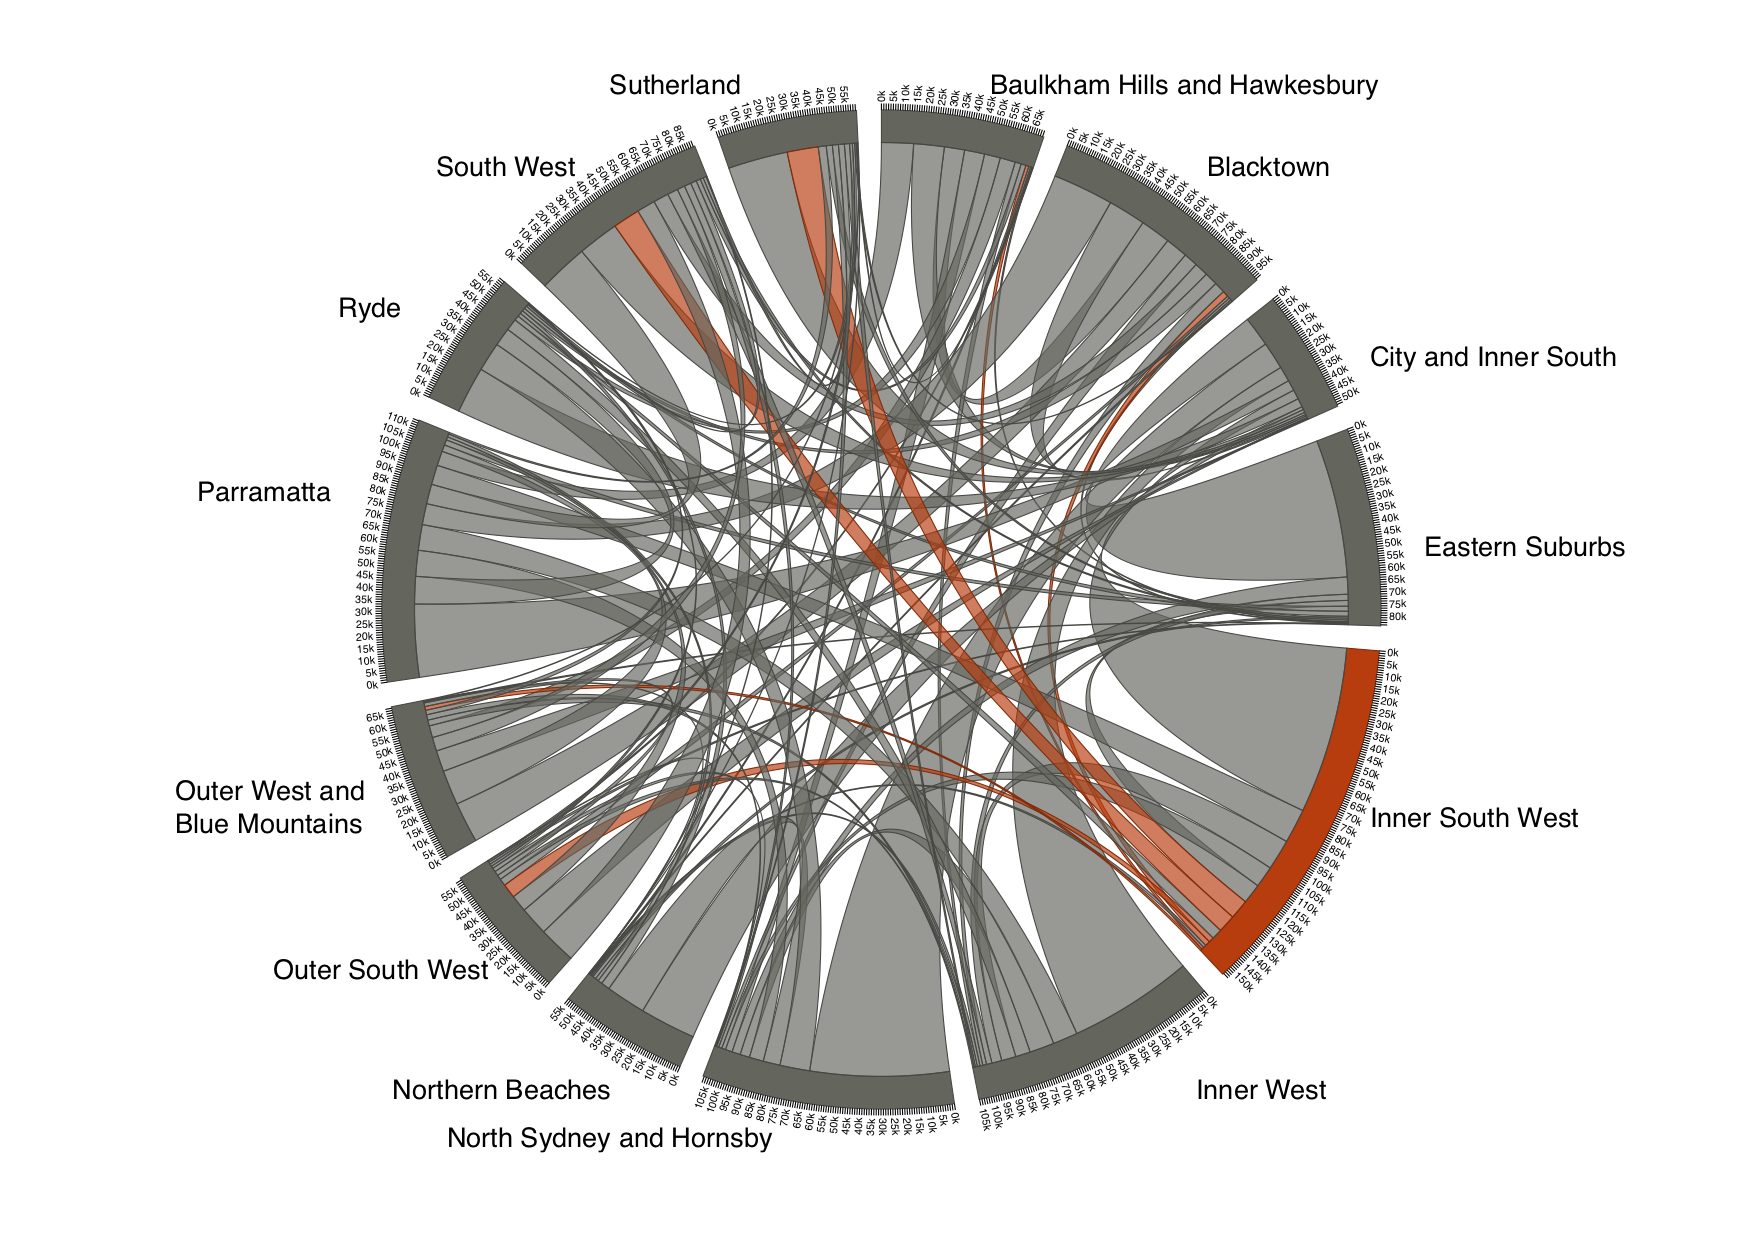
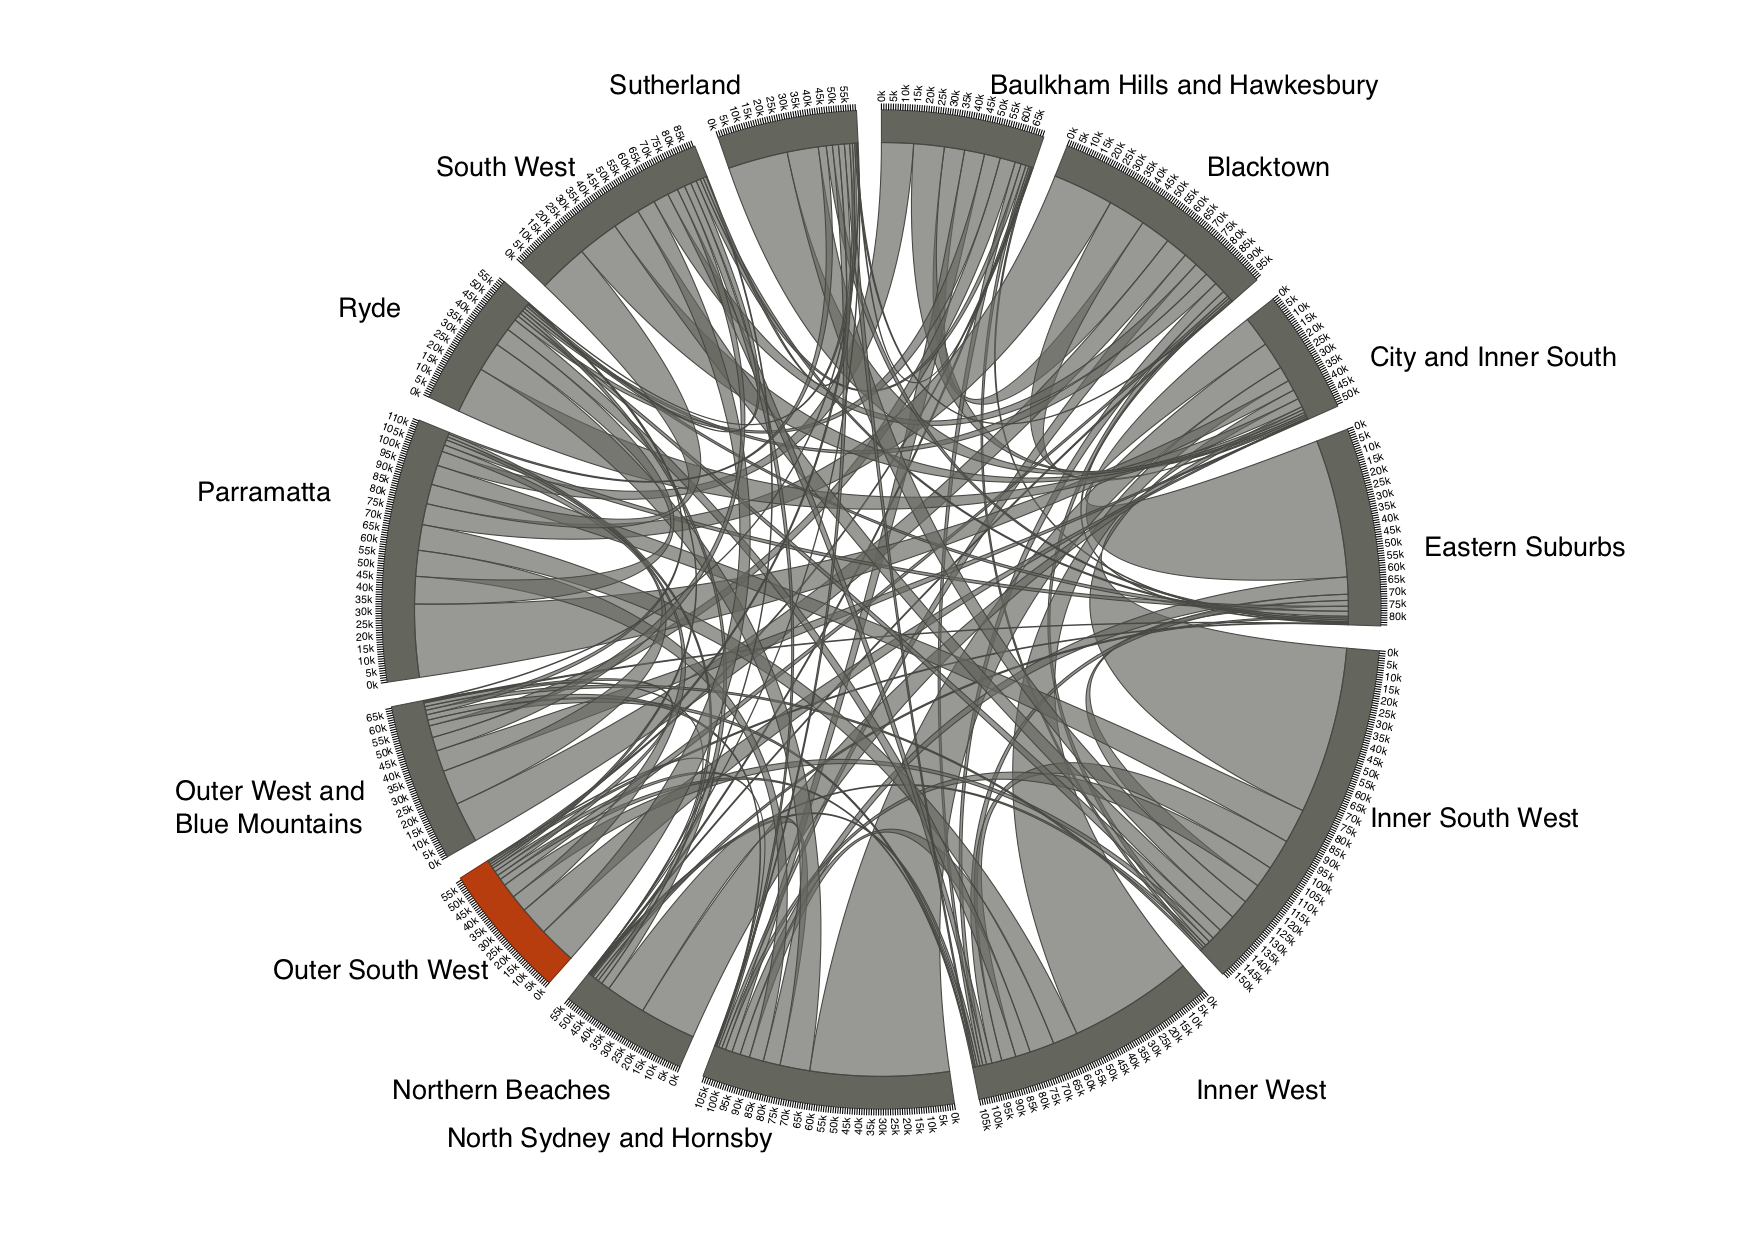
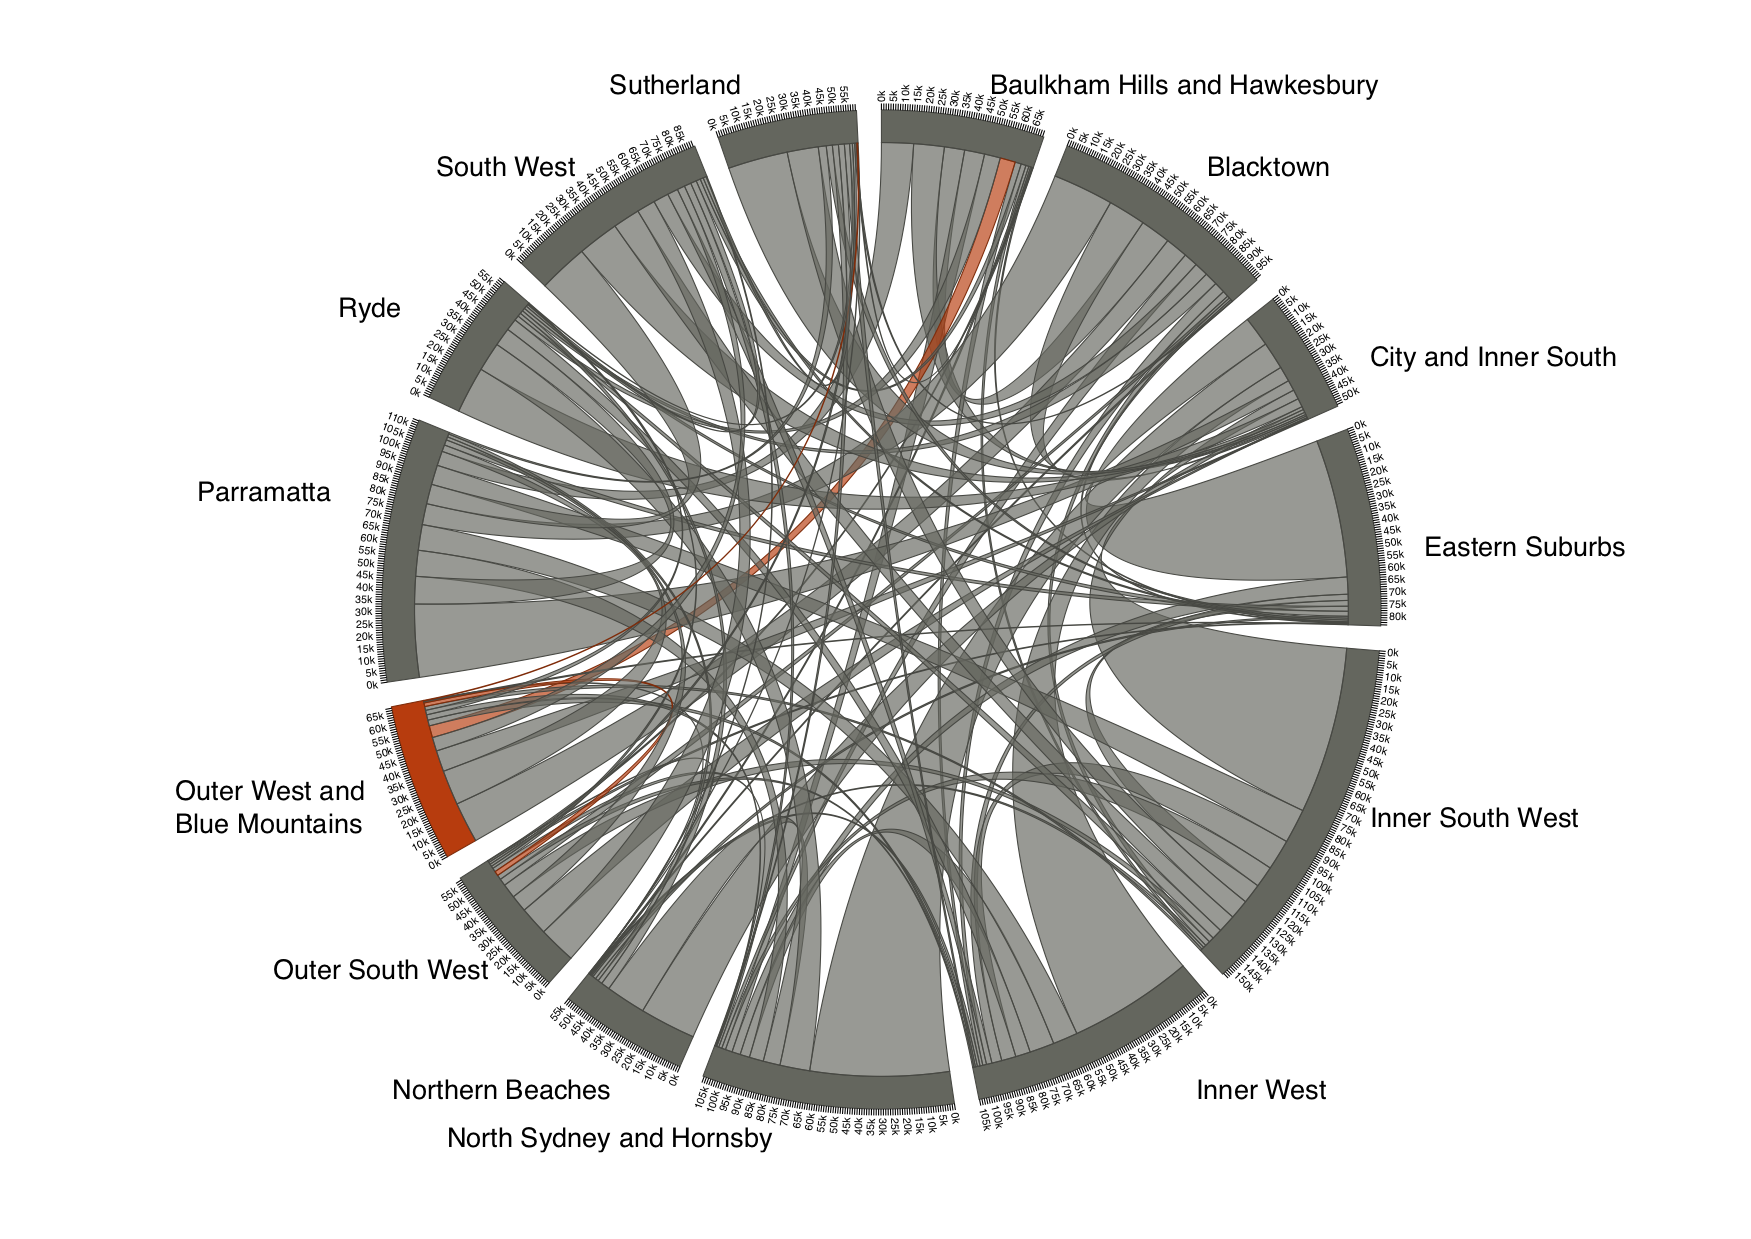
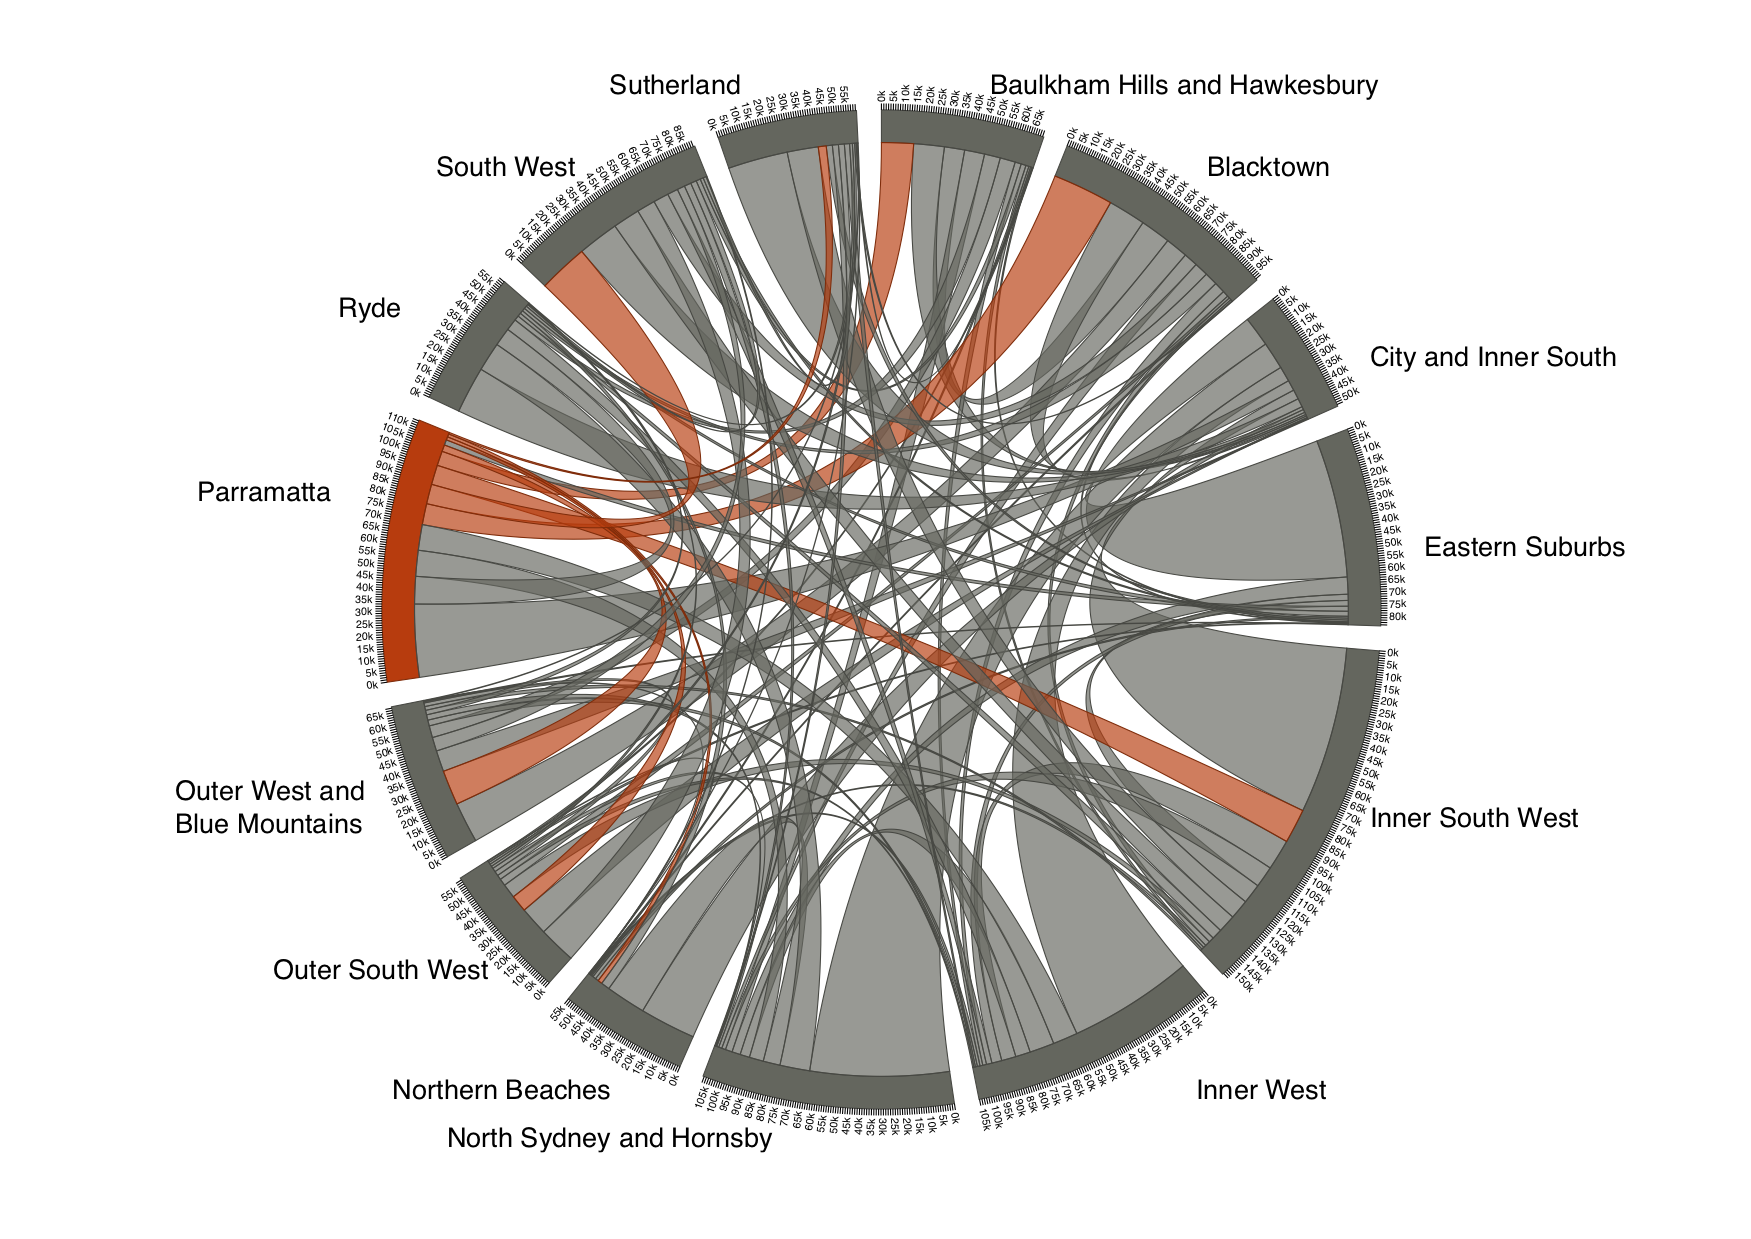
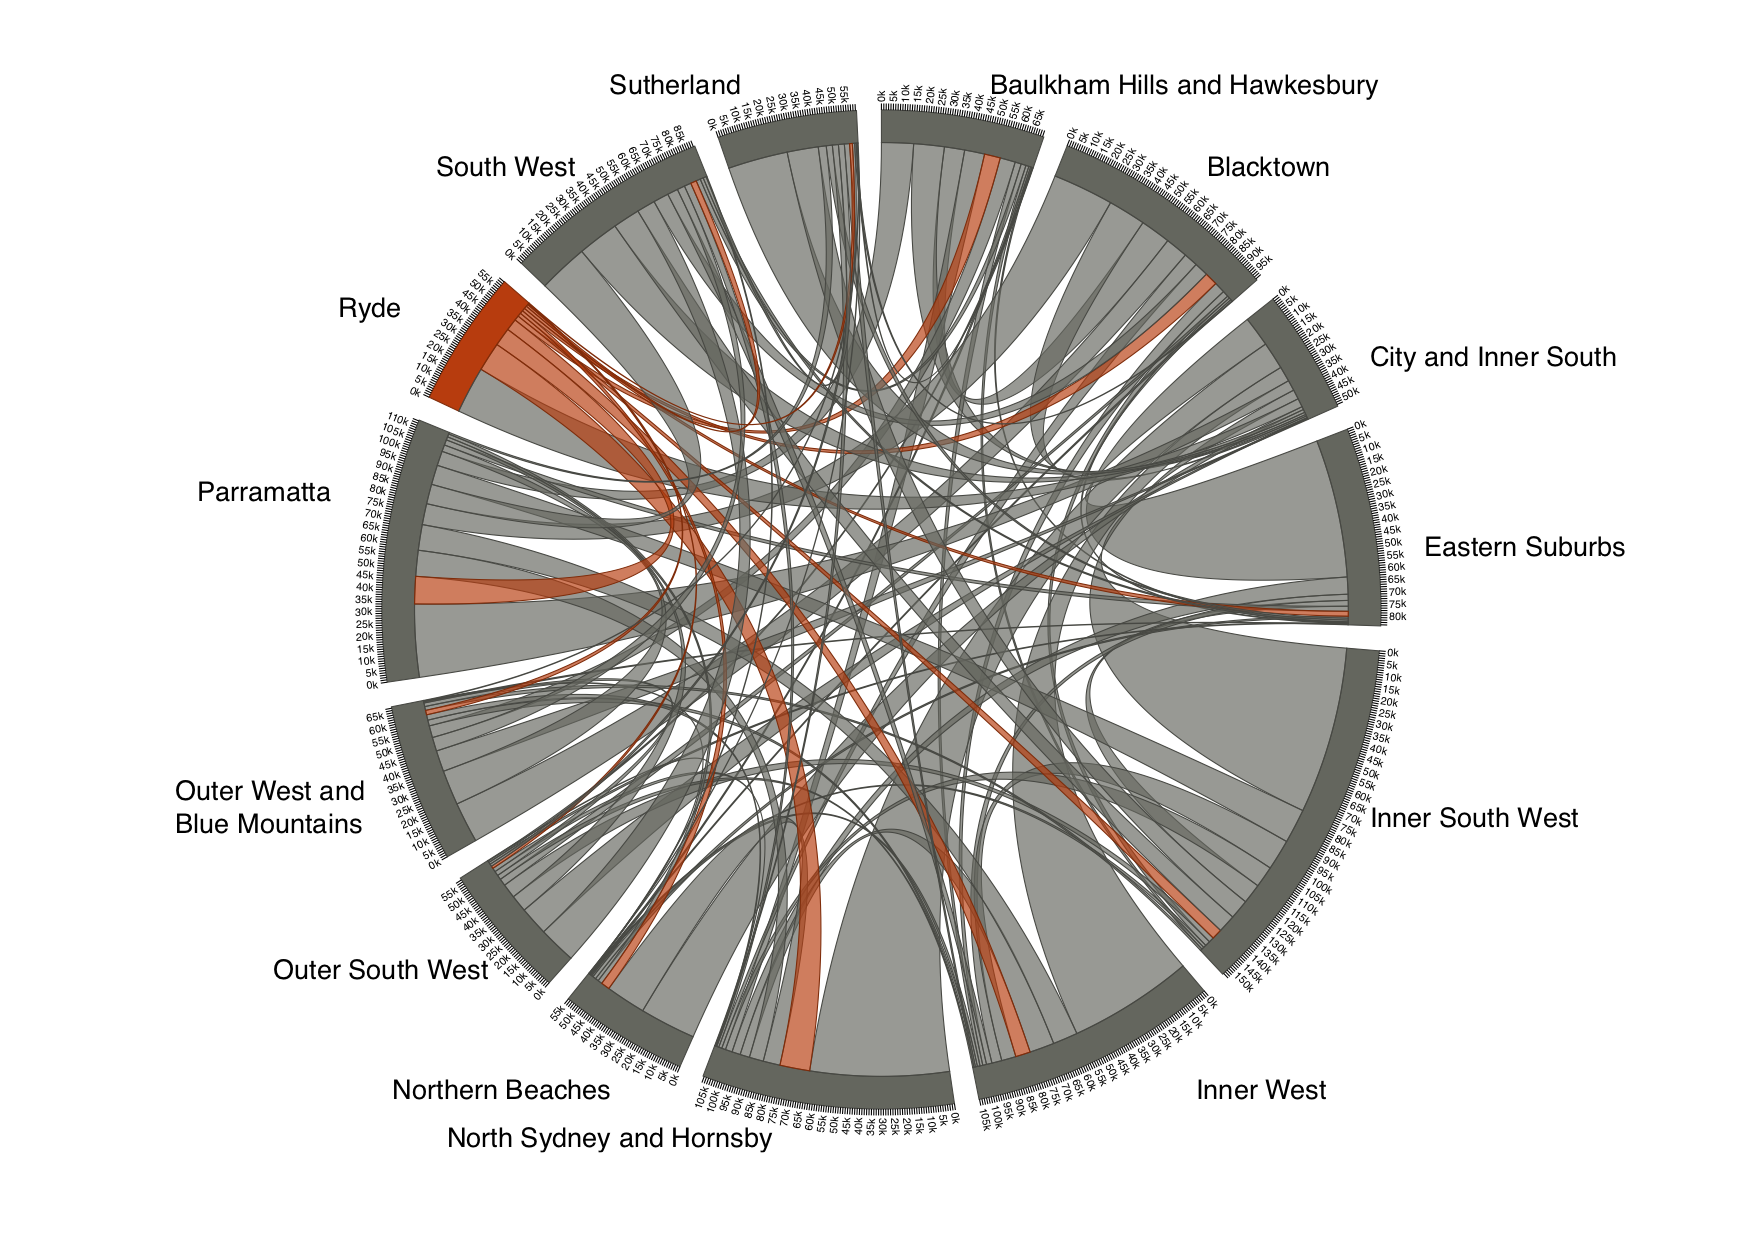
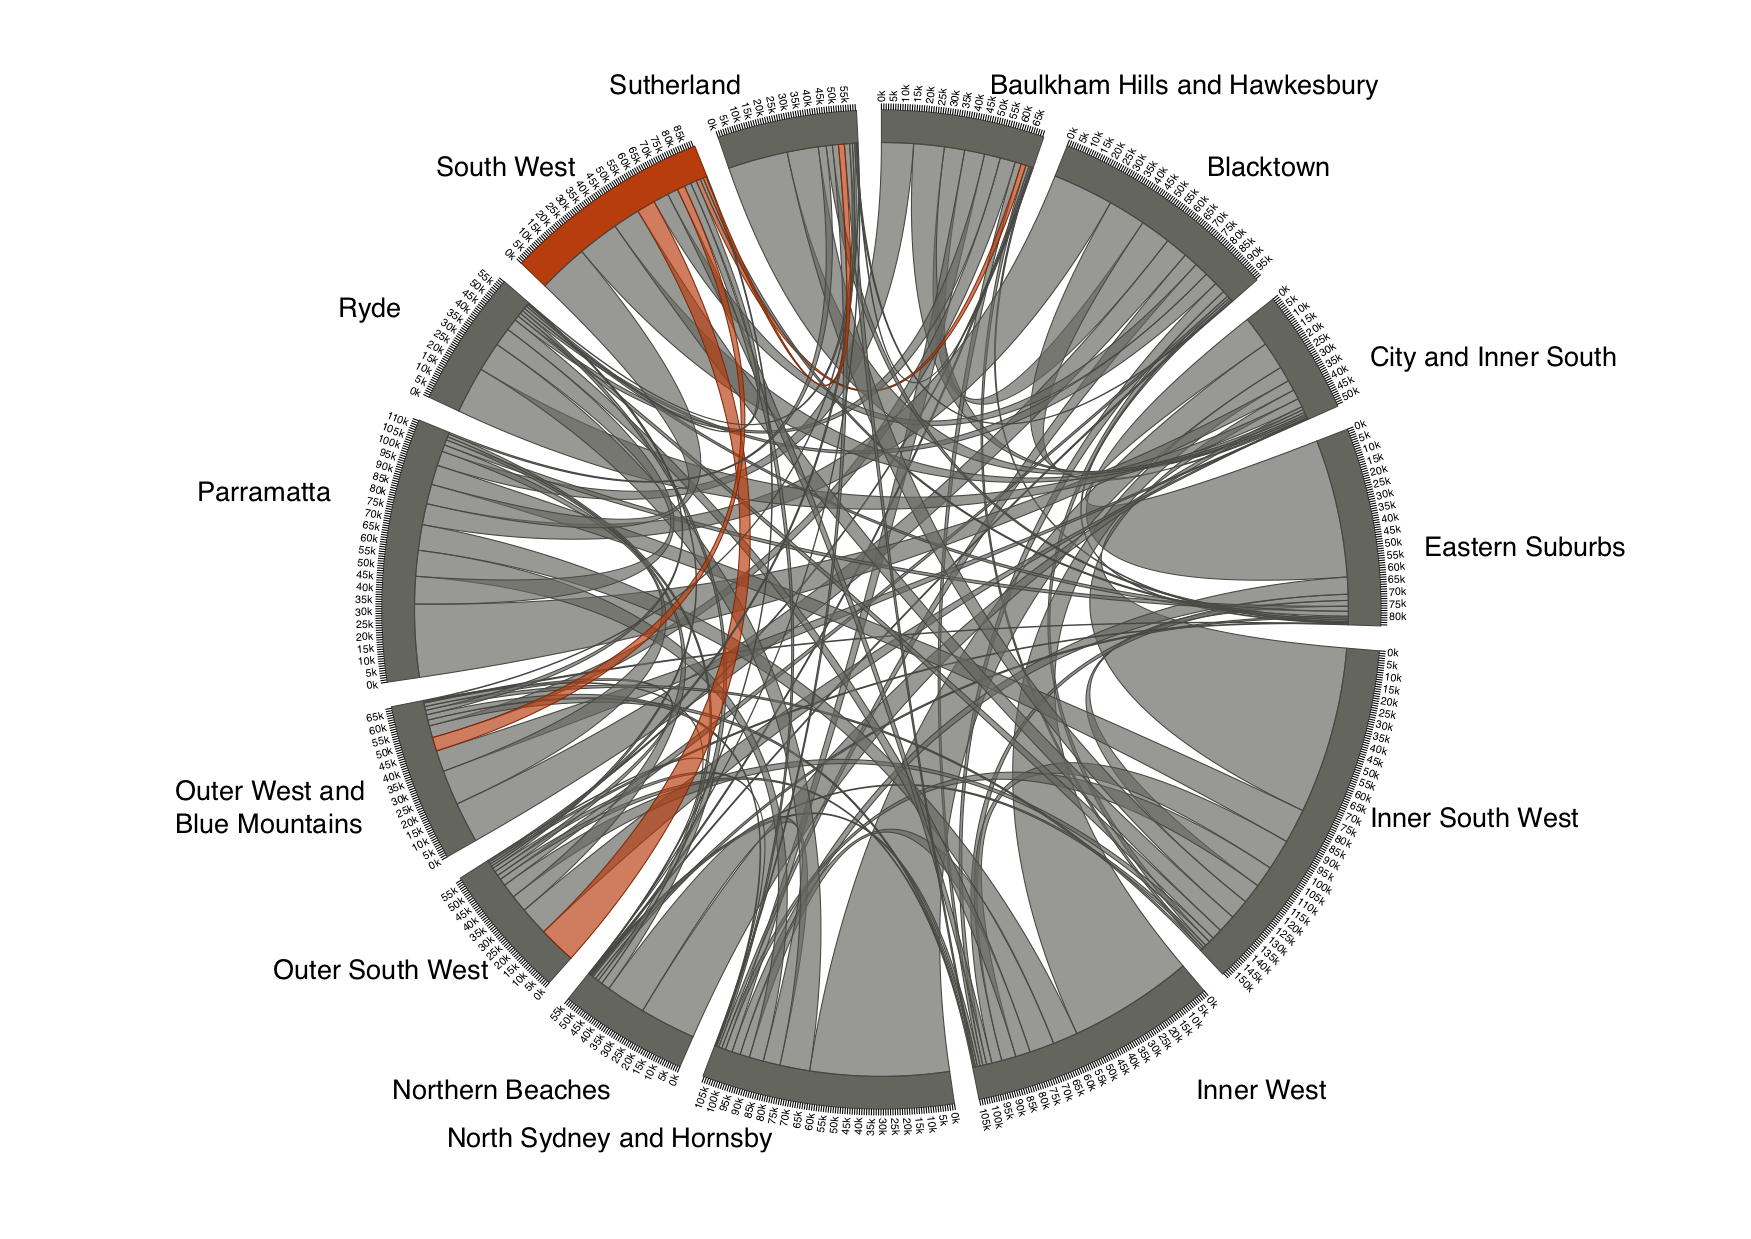
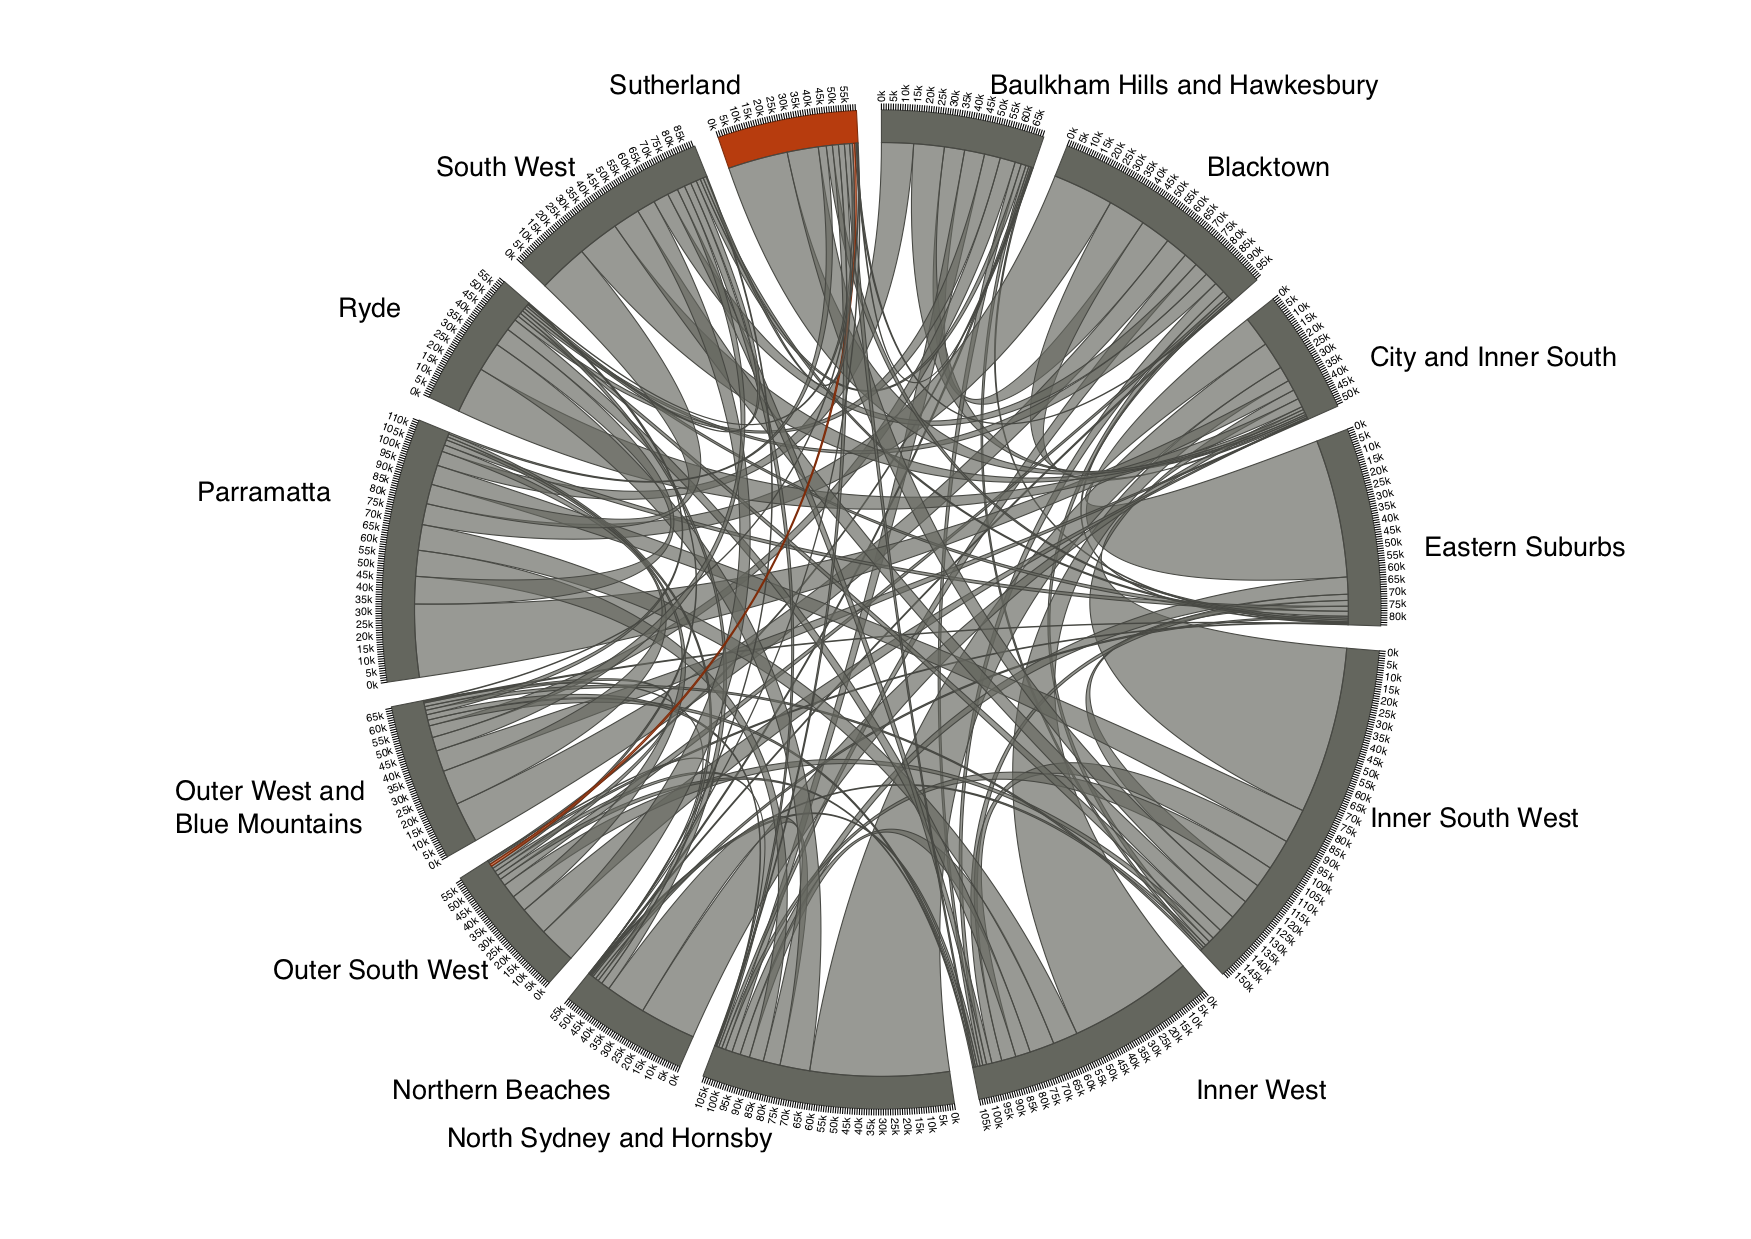
The base arc for each region shows the number of people residing there.
The width of each link at the base is the number of people who travel from
that region to somewhere else to work. A link is coloured orange if the
number of people traveling to a focus location is larger than the number
of people traveling from this focus location. The more orange the picture,
the bigger that location's role as "center".
Sydney plans to move towards a more polycentric organization.
Historically, the largest center, the Central Business District (CBD) in
the City and Inner South SA4, is still clearly the largest center (its all
orange). Parramatta, which is planned as the second CBD, shows much weaker
"center-ness" as compared to the dominant CBD. Thus, the analysis shows
that if a polycentric Sydney with 30 minute neighborhoods is to be
realised, a lot of journey to work re-organization and planned increases
of employment in all planned centers are called for. At the moment, the
true Sydney is mostly monocentric, with most second-order centers close to
the main CBD, and lots of dispersed employment.
The chord diagrams have been generated using 2016 Census Journey to Work
data, and the Javascript library d3.js.
|
|
|
1. Baulkham Hills and Hawkesbury
|
2. Blacktown
|
|
|
|
3. City and Inner South
|
4. Eastern Suburbs
|
|
|
|
5. Inner South West
|
6. Inner West
|
|
|
|
7. North Sydney and Hornsby
|
8. Northern Beaches
|
|
|
|
9. Outer South West
|
10. Outer West and Blue Mountains
|
|
|
|
11. Parramatta
|
12. Ryde
|
|
|
|
13. South West
|
14. Sutherland
|
(c) 2025 Somwrita Sarkar